 ar
ar bg
bg hr
hr cs
cs da
da nl
nl fi
fi fr
fr de
de el
el hi
hi it
it ko
ko no
no pl
pl pt
pt ro
ro ru
ru es
es sv
sv tl
tl iw
iw id
id lv
lv lt
lt sr
sr sk
sk sl
sl uk
uk vi
vi et
et hu
hu th
th tr
tr fa
fa ms
ms hy
hy ka
ka ur
ur bn
bn mn
mn ta
ta kk
kk uz
uz ku
ku
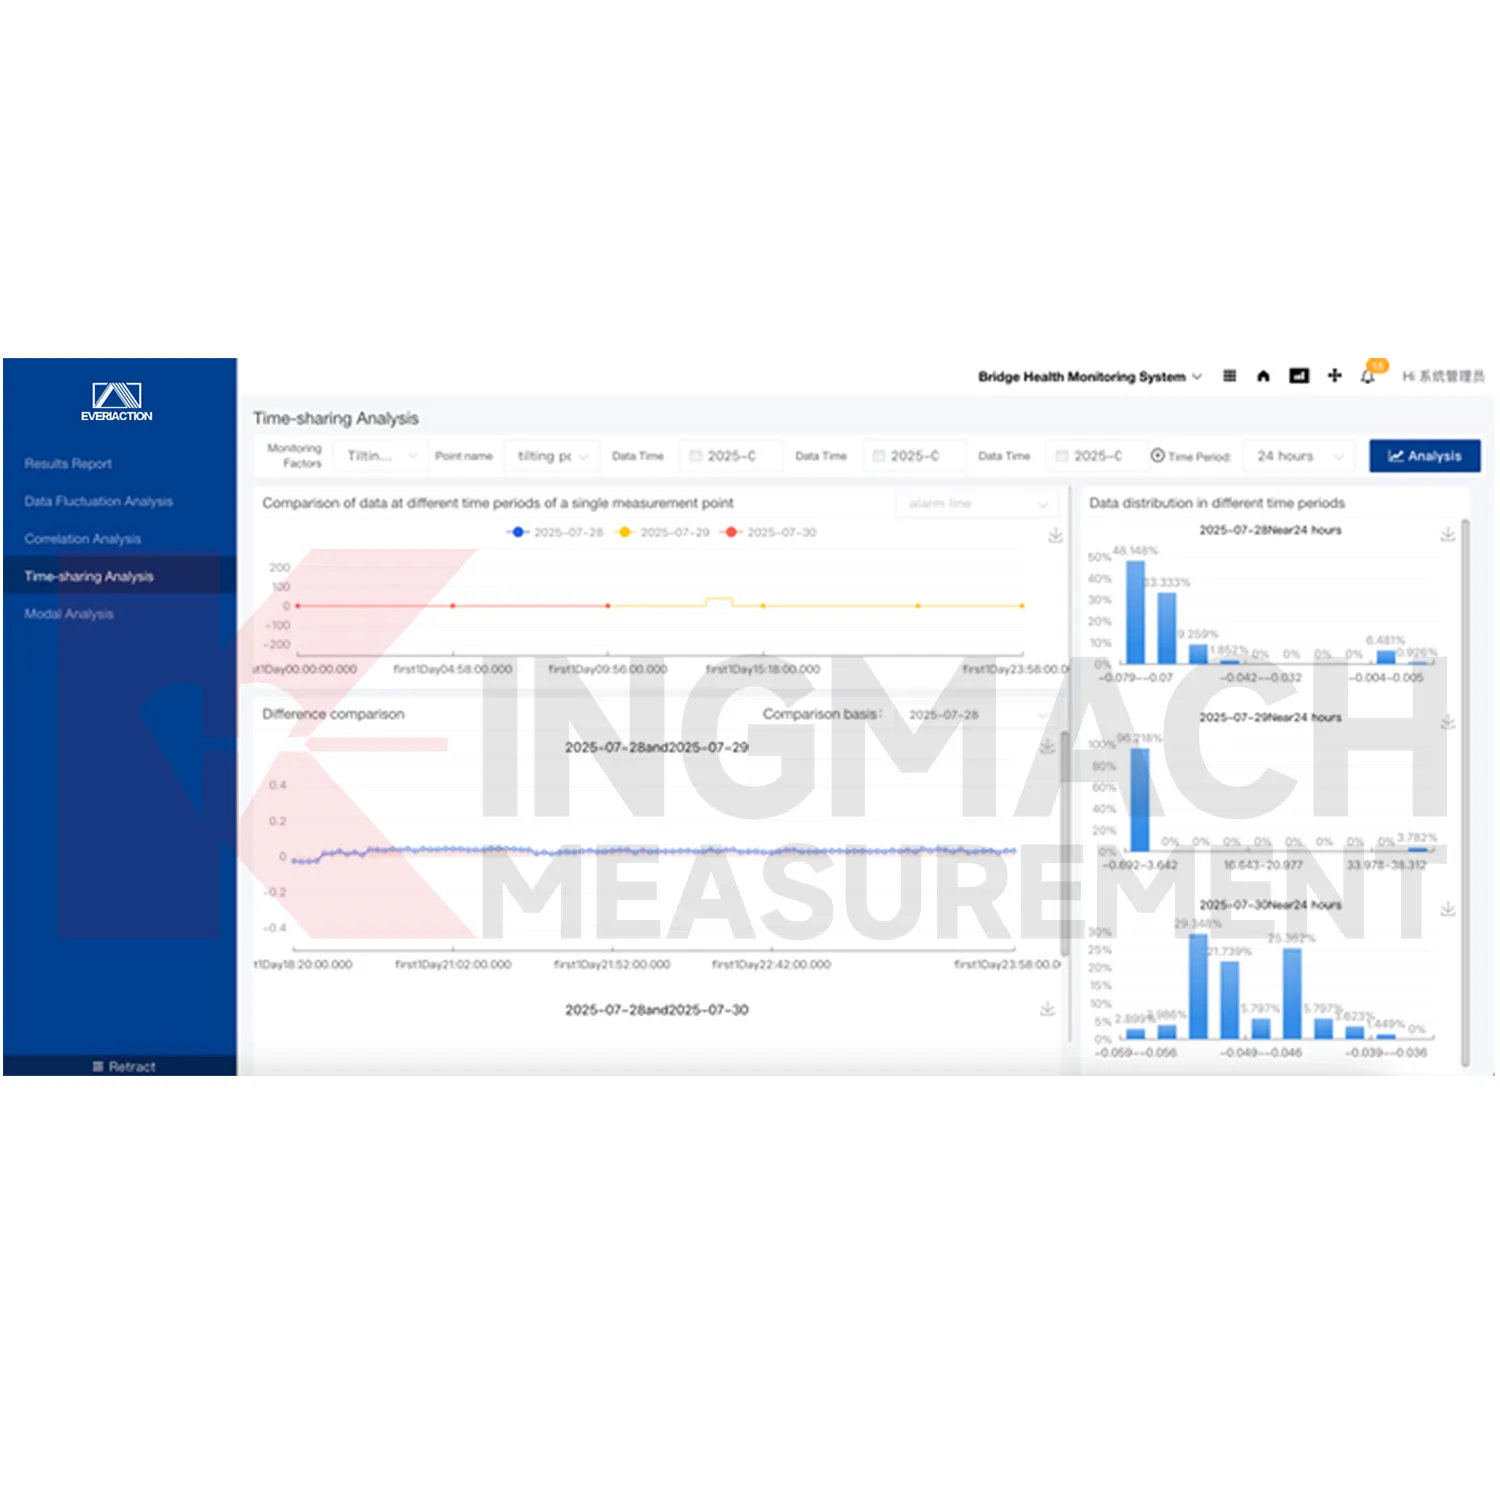
Visualization Software
The Visualization Software lists Changsha, China, as the place of origin, Kingmach as the brand, GB50982-2014 as the certification, and a minimum order quantity of one piece. Pricing is negotiable, payment terms are T/T in advance, and delivery time is listed as instant. These business details are useful when the platform is purchased together with sensors, data loggers, acquisition modules, communication devices, or a wider monitoring package. They also show that the software is treated as a formal product category within the Kingmach monitoring range.
Application of Visualization Software
Wind tower monitoring uses Kingmach Visualization Software to combine tower tilt, vibration, foundation behavior, strain, wind, temperature, and maintenance records. A tower may respond differently under high wind, temperature change, operation state, and foundation conditions. The platform can visualize trends and preserve event history so reviewers can compare repeated behavior under similar conditions. Alarm configuration helps identify readings that need field inspection without treating every normal operating fluctuation as a fault.
The future of Visualization Software
Cybersecurity and data governance will become more visible around Kingmach Visualization Software. The local product file notes multiple security protocols and transmission methods. As monitoring data moves through cloud systems and remote access points, users will need clearer rules for account access, data storage, document control, alarm review, and report release. Strong governance helps protect the integrity of structural safety records and keeps responsibility clear across owners, operators, and engineering teams.
Care & Maintenance of Visualization Software
Backup and export planning protects Kingmach Visualization Software records. Monitoring data, alarm histories, reports, and project documents may be needed for maintenance, audits, claims, or engineering review years after collection. Define who can export data, how often backups are checked, and where report files are stored. If the platform is integrated with other systems, confirm that exported timestamps, units, point names, and alarm states remain readable outside the original view.
Kingmach Visualization Software
Kingmach Visualization Software helps users move from raw readings to risk awareness. The platform can build structural safety models, use formulas, algorithms, and manual engineering review to determine the location and extent of structural damage, and warn of changes in structural performance. This does not replace field inspection; it makes inspection better targeted. When a bridge cable, tunnel lining, slope, dam gallery, or building foundation shows a changing pattern, the data view can point reviewers toward the affected area, related sensors, and alarm record. That gives site teams a clearer starting point for follow-up.
FAQ
Q: How are trend curves used?
A: They help compare current readings with earlier behavior so gradual movement, sudden jumps, or event response can be reviewed.
Q: What does real-time filtering help with?
A: It reduces noisy or distracting records before users study the channel history.
Q: How do alarms guide action?
A: Configured rules point users toward the affected point, severity level, time, and related follow-up record.
Q: What makes reports easier?
A: Stored trends, alarms, project files, and expert review notes can be gathered without rebuilding the evidence manually.
Q: Why is graphical display useful?
A: Graphs help users see movement direction, timing, and abnormal patterns faster than raw tables alone.
Reviews
Joshua Clark
We ordered a full monitoring solution including sensors and data loggers. Everything works seamlessly together. Great supplier!
Andrew Lee
The visualization software is intuitive and powerful. It helps us analyze monitoring data efficiently.
Latest Inquiries
To protect the privacy of our buyers, only public service email domains like Gmail, Yahoo, and MSN will be displayed. Additionally, only a limited portion of the inquiry content will be shown.
Harper***@gmail.comIndia
Dear Sir, we are planning to procure a complete monitoring system including strain gauges, tiltmeter...
Sophia***@gmail.comUnited Kingdom
Good day, we need environmental monitoring sensors including temperature, humidity, and wind sensors...
Related product categories
- Monitoring Software Suite
- Monitoring system software platform
- Environmental Monitoring
- Visualization Software
- GPS Displacement Monitoring System
- Integrated Monitoring Station
- Settlement Monitoring Rod
- Structural Health Monitoring (SHM) System
- Structural Monitoring Cloud Platform
- IoT Online Monitoring System
- Monitoring System Platform & Services
- Engineering Pulse Intelligent Monitoring Cloud Platform