 ar
ar bg
bg hr
hr cs
cs da
da nl
nl fi
fi fr
fr de
de el
el hi
hi it
it ko
ko no
no pl
pl pt
pt ro
ro ru
ru es
es sv
sv tl
tl iw
iw id
id lv
lv lt
lt sr
sr sk
sk sl
sl uk
uk vi
vi et
et hu
hu th
th tr
tr fa
fa ms
ms hy
hy ka
ka ur
ur bn
bn mn
mn ta
ta kk
kk uz
uz ku
ku
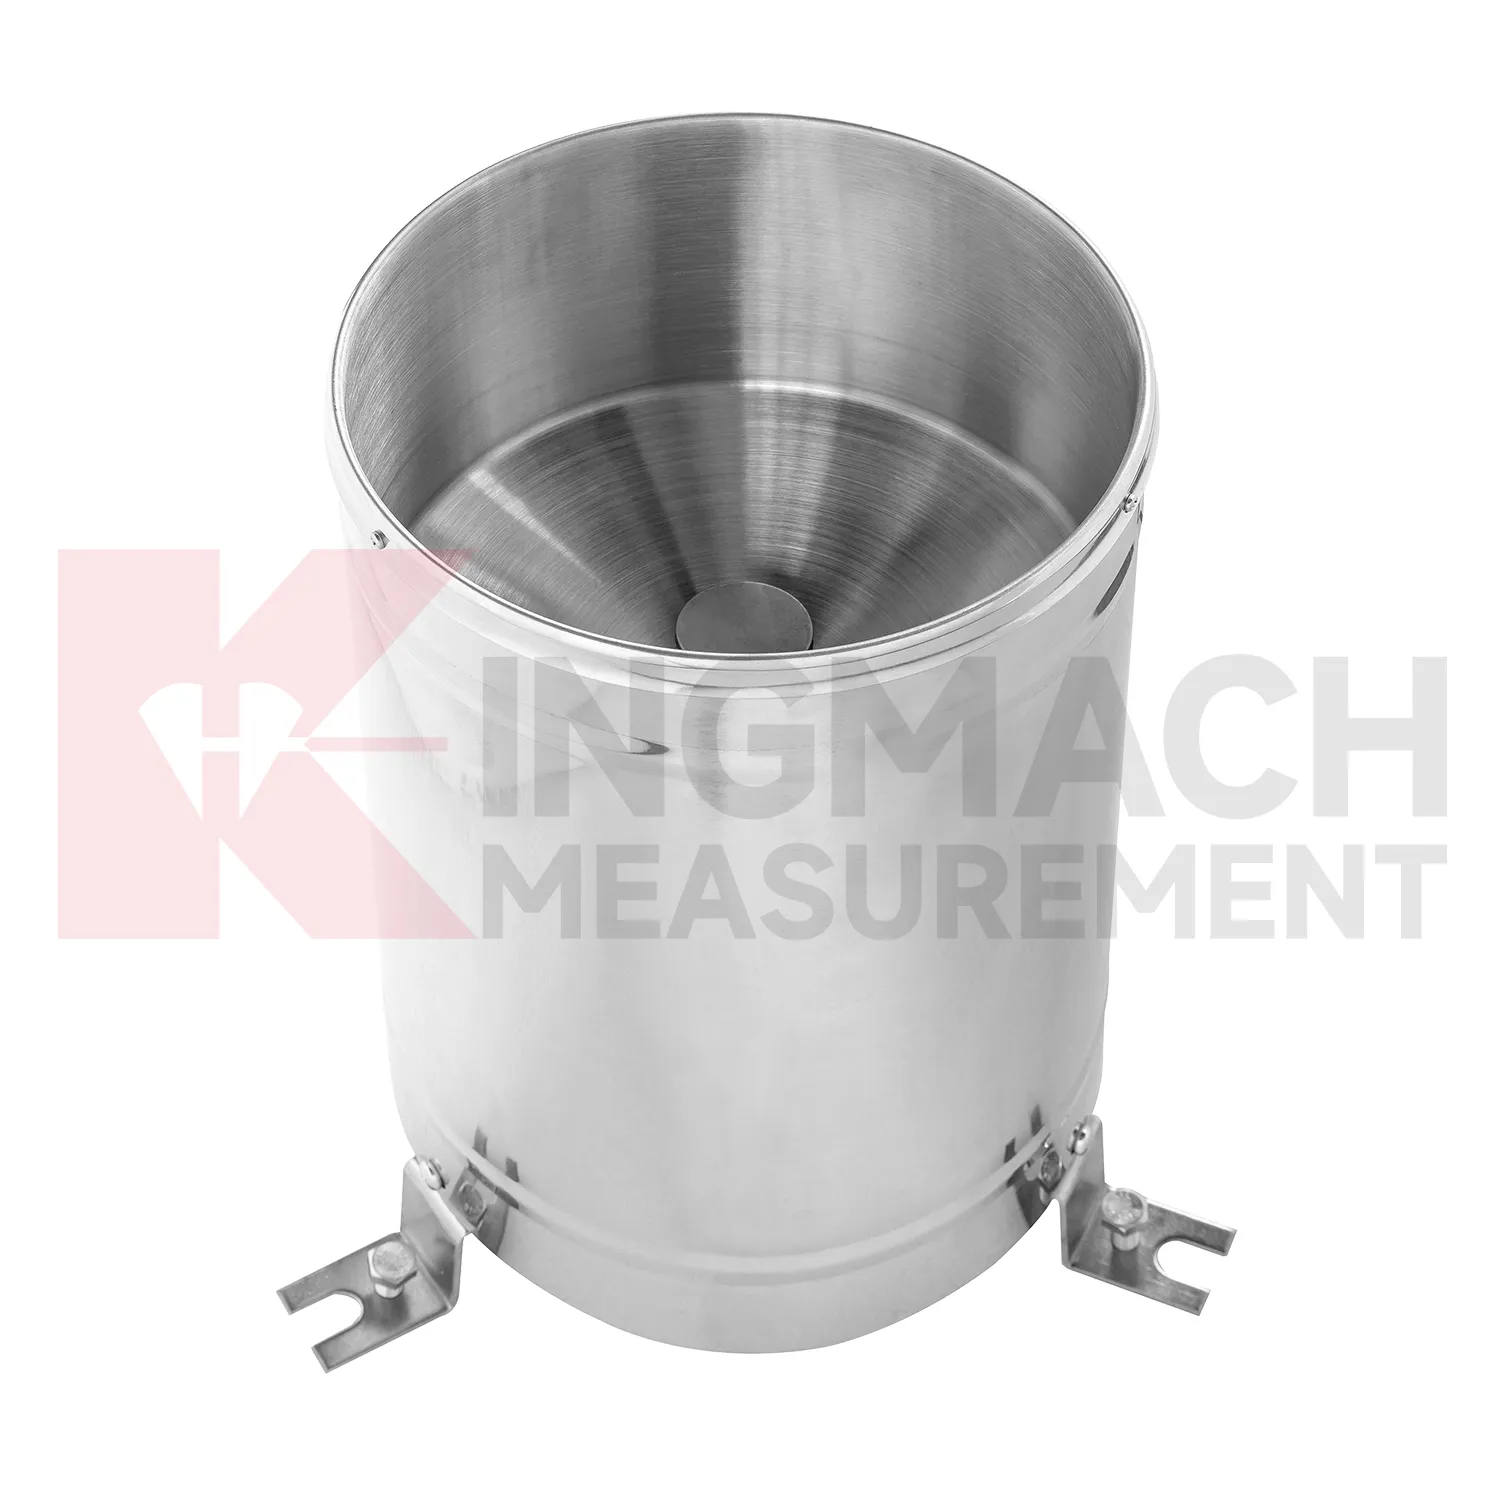
soil moisture sensor
Rainfall monitoring in Kingmach soil moisture sensor provides the time record behind many water-related engineering events. A rain point should be open to the sky, level, clean, and protected from splash, leaves, dust, and nearby obstructions. The data is useful because it turns a storm into a dated sequence that can be compared with slope movement, seepage, runoff, settlement, pore pressure, tunnel leakage, or construction delays. Long-term rainfall records also help owners understand seasonal behavior. A small storm after many wet days may create more response than a larger storm after dry weather. A well-maintained rainfall record helps explain that difference. For reports, the most useful information is not only the total rain amount, but also timing, duration, intensity pattern, and whether related ground or structural sensors changed afterward.
During abnormal events, the first question is not only whether the value crossed a limit. The reviewer should ask what changed around the site, whether the related structure reacted, and whether a field inspection confirmed the same pattern.
Long-term value comes from consistency. A channel that keeps the same location, unit, maintenance history, and linked asset record can support seasonal comparison, post-storm review, and handover between construction and operation teams.
Maintenance teams should record cleaning, access difficulty, enclosure condition, cable repair, vegetation growth, nearby equipment changes, and the first normal reading after work. Those notes protect the meaning of the curve when old data is reviewed months later.
Application of soil moisture sensor
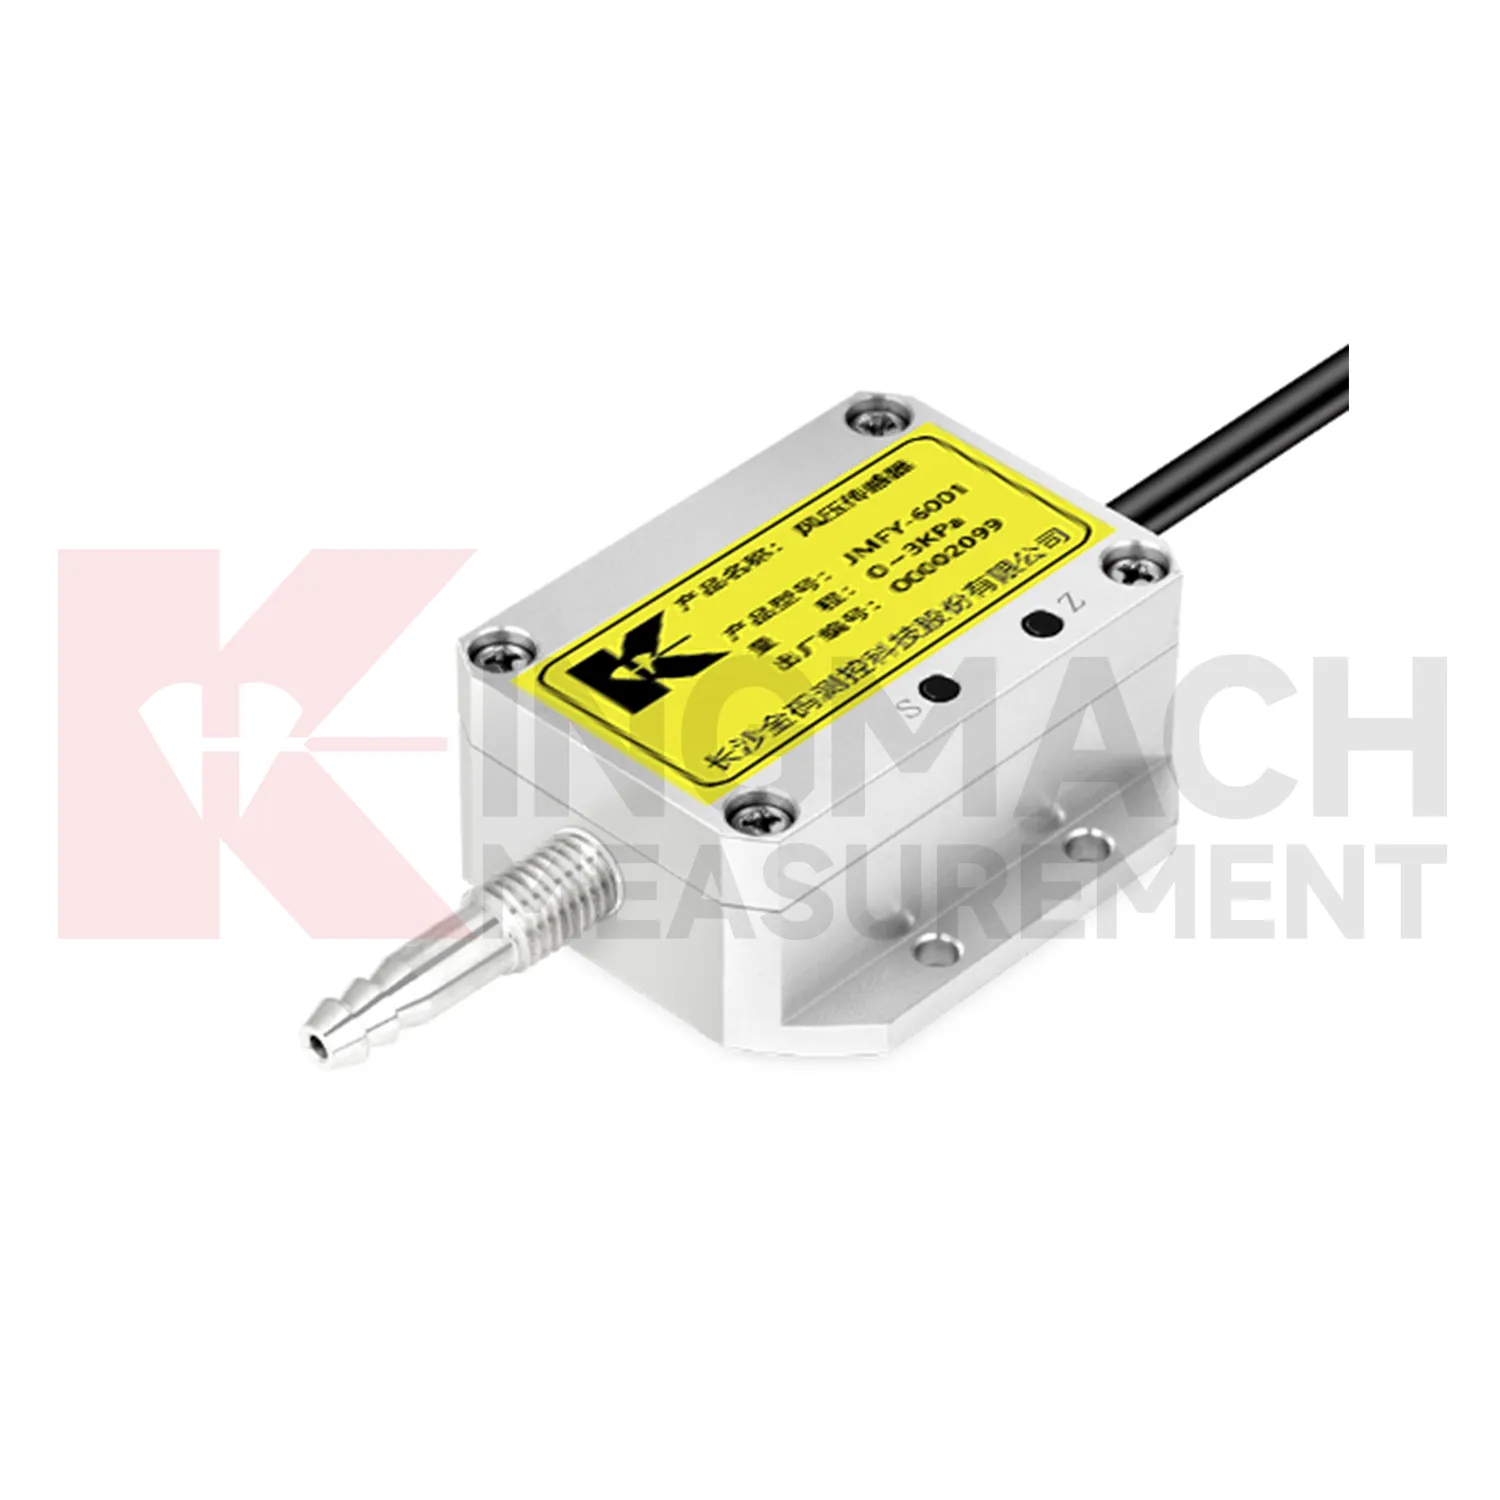
Construction sites use Kingmach soil moisture sensor to document conditions that affect work, monitoring data, and later dispute review. Rain can change excavation safety, slope behavior, access roads, concrete work, and water management. Wind can affect lifting, temporary structures, and exposed frames. Temperature and humidity can affect curing, equipment rooms, and sensor cabinets. Environmental data should be collected where it represents the active work zone and should be reviewed beside displacement, settlement, vibration, crack, and inspection records. If a movement change occurs after a storm or heavy wind event, the environmental timeline helps engineers explain the timing. It also gives contractors and owners a shared record instead of relying on memory or informal weather notes.
A practical report links the condition value with time, place, and action. It should help a reviewer decide whether to keep observing, inspect the field point, compare nearby instruments, or record the event as normal site behavior.
For owners, the strongest record is the one that remains understandable after staff changes. Clear units, plain point names, installation photos, maintenance notes, and linked structural channels make the data usable beyond the original project team.
For field teams, this point is most useful when the record shows the condition before the structural response, during the response, and after the site returns to routine operation. The note should include weather timing, inspection access, nearby construction, and whether the linked structural points changed in the same period.
The future of soil moisture sensor
Remote station health will become more important for Kingmach soil moisture sensor. Environmental points are often placed on slopes, bridges, dams, towers, construction sites, and irrigation areas where access is inconvenient. A future-ready station should report whether it is powered, communicating, collecting plausible values, and recently maintained. Missing data during a storm can be more serious than missing data during calm weather. Maintenance teams need to know whether a silence means quiet conditions, power trouble, blocked equipment, or communication loss. Better station-health reporting will help owners trust environmental data during the events that matter most.
Maintenance teams should record cleaning, access difficulty, enclosure condition, cable repair, vegetation growth, nearby equipment changes, and the first normal reading after work. Those notes protect the meaning of the curve when old data is reviewed months later.
The environmental point should be part of a named monitoring question. It may explain wetting, drying, wind exposure, thermal movement, cabinet stress, or pressure variation, but that purpose needs to be visible in drawings and reports.
Care & Maintenance of soil moisture sensor
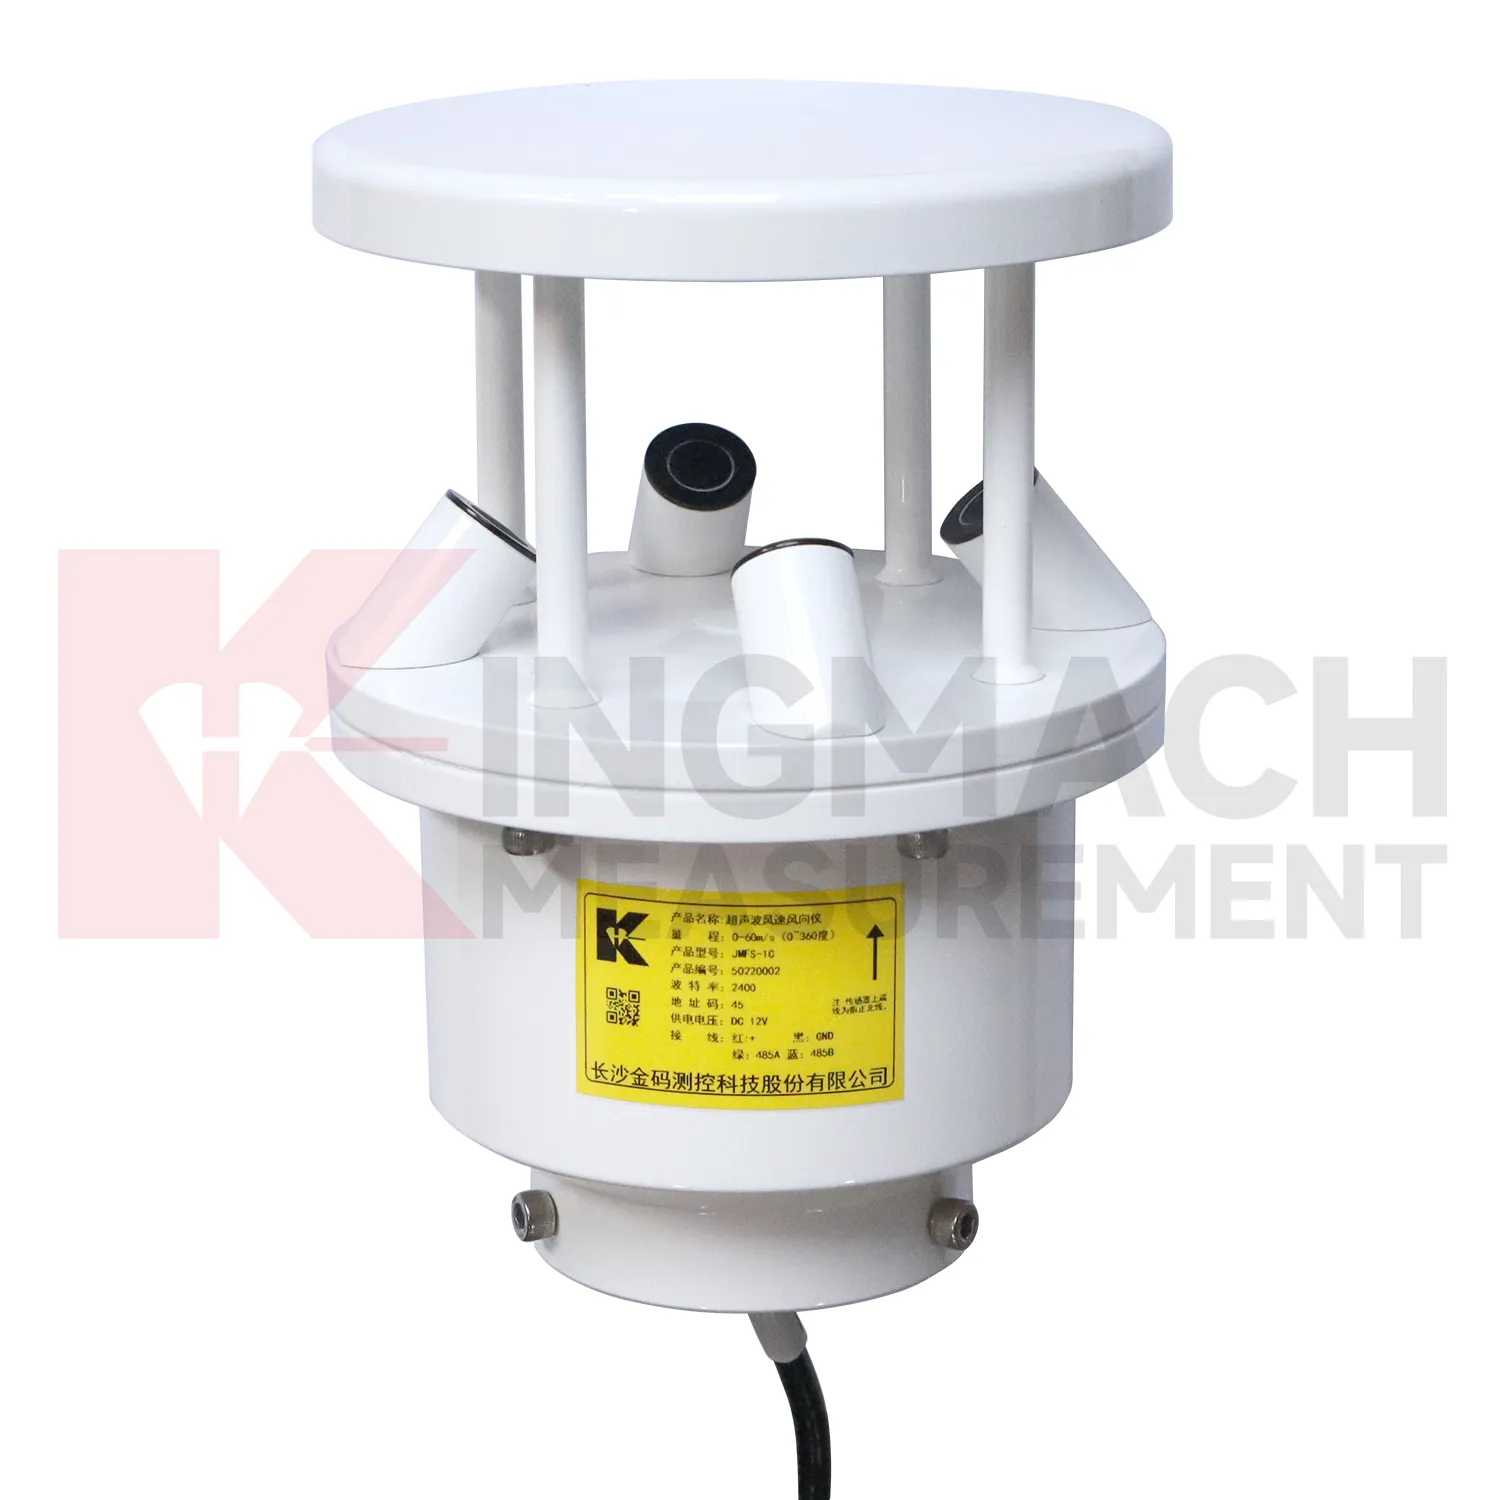
Wind-station maintenance for Kingmach soil moisture sensor should preserve exposure and mounting stability. Check for new obstructions, loose poles, tilted brackets, damaged connectors, lightning effects, corrosion, ice, salt, dust, and cable strain. The wind point should represent the monitored bridge, tower, airport area, marine site, tunnel portal, or construction zone. If a nearby structure, scaffold, crane, or temporary cover changes airflow, the record may no longer explain the asset. Maintenance notes should state what was inspected, what was cleaned, and whether the first readings after work looked normal. Reliable wind data depends on both instrument condition and a clear flow path.
A good review habit is to compare the condition channel with the nearest asset behavior instead of reading it as a standalone weather value. That keeps the record tied to slope movement, bridge response, tunnel equipment, dam seepage, drainage behavior, or cabinet reliability.
The installation file should explain why the location represents the monitored area. If the point is sheltered, shaded, exposed, buried, elevated, or placed inside an enclosure, that fact changes how later readings should be understood by maintenance staff.
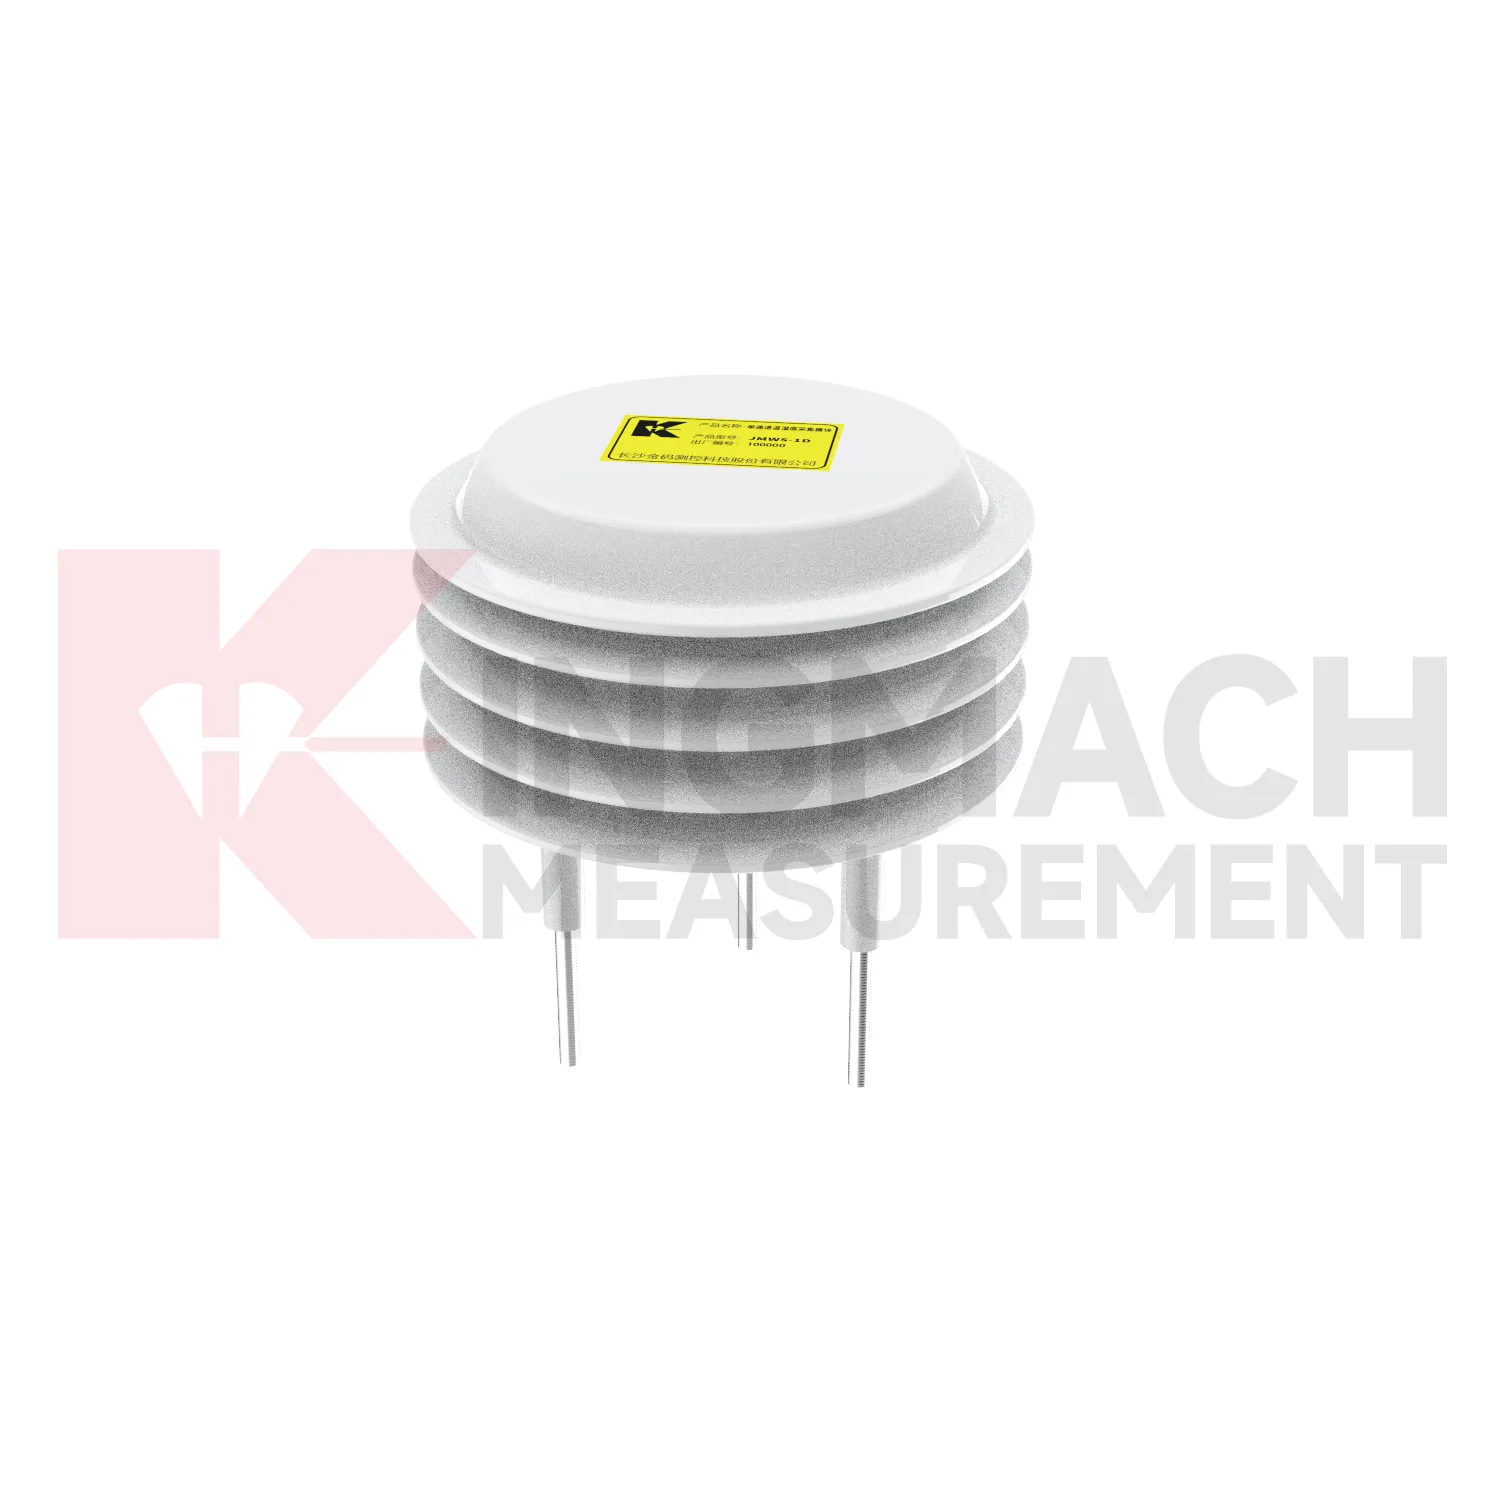
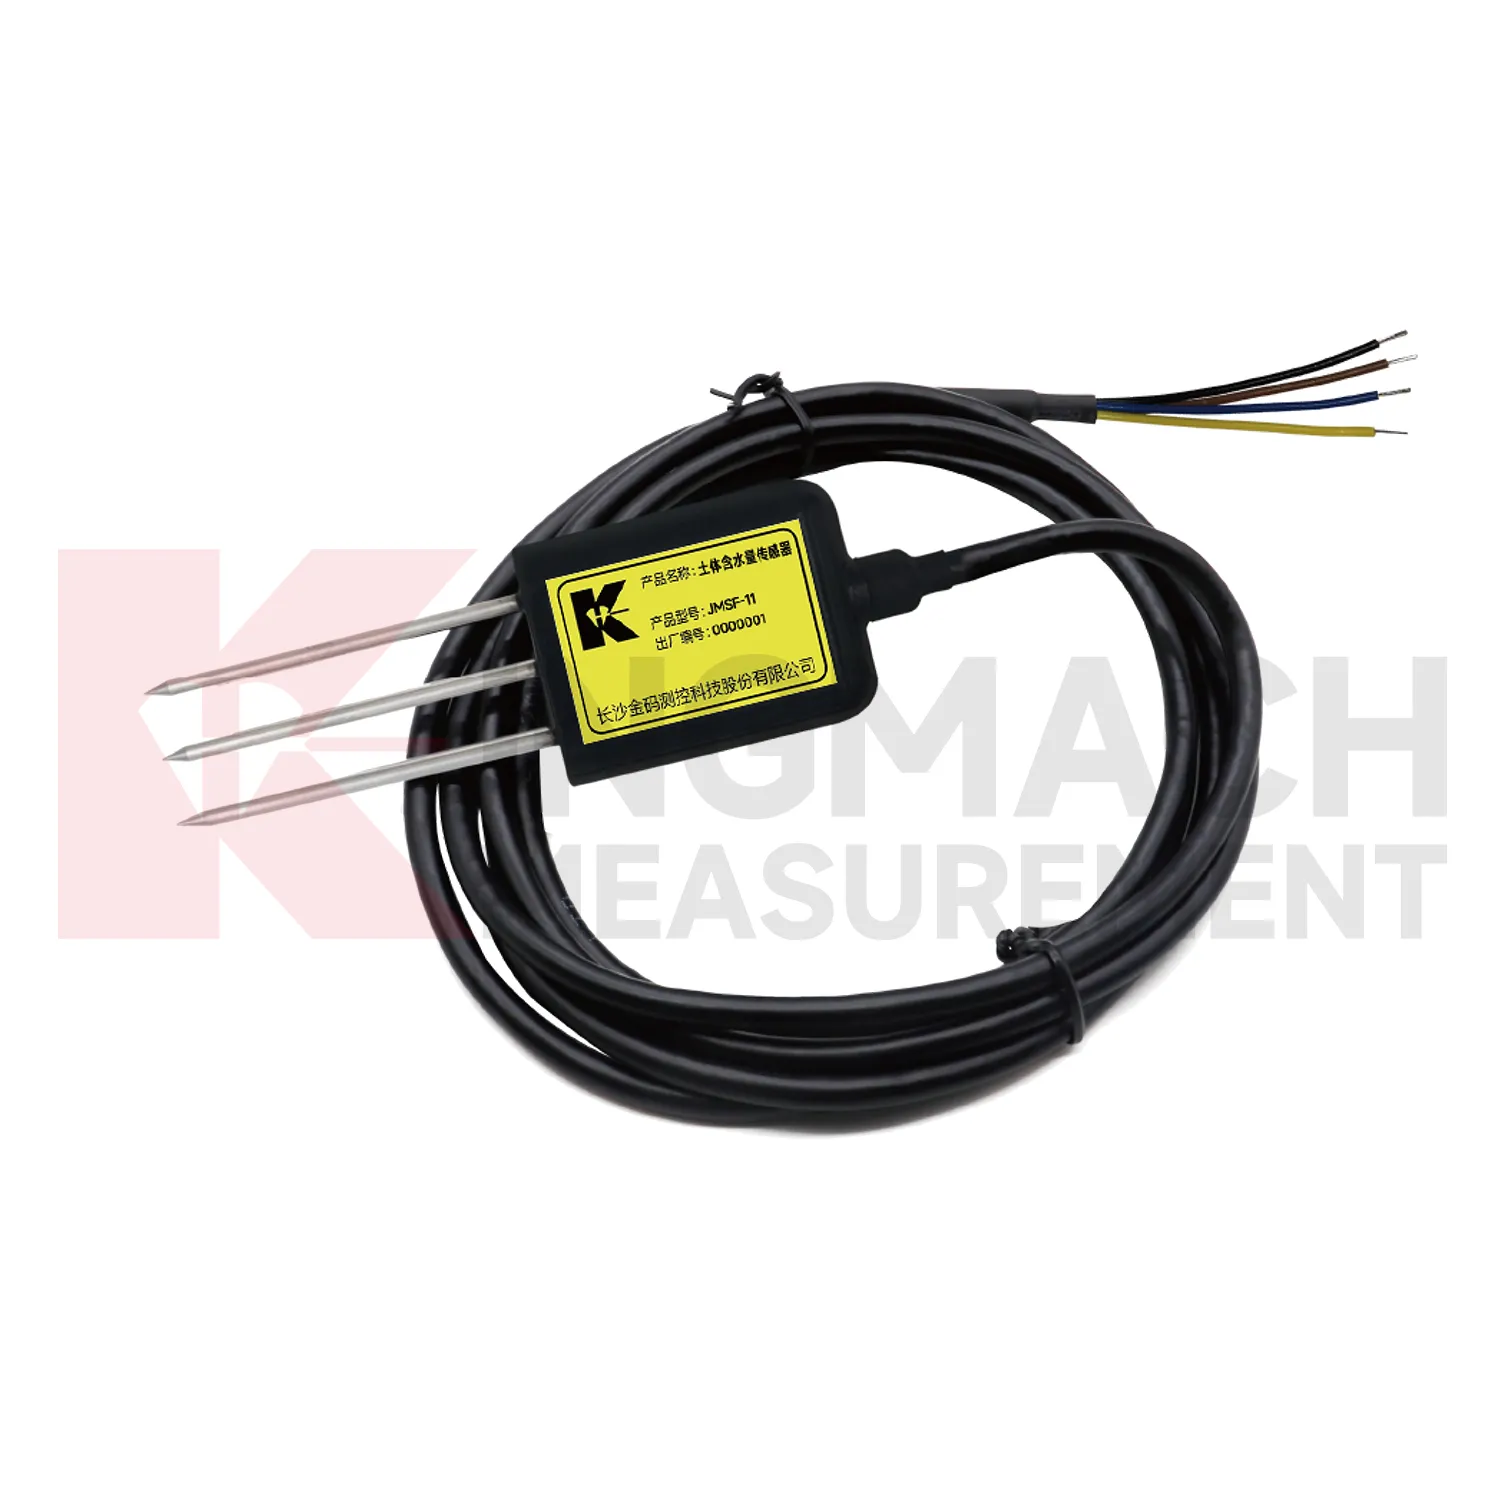
Kingmach soil moisture sensor
Soil wetness gives Kingmach soil moisture sensor a direct link between weather and ground behavior. Surface rainfall alone does not show whether water reached the depth where deformation is occurring. Buried moisture readings help engineers see wetting, drying, irrigation effect, drainage performance, and seasonal change inside the soil body. This is important for slopes, embankments, greenhouses, agricultural projects, hydraulic works, and reclamation areas. A soil record should be tied to depth, soil type, cable route, and nearby deformation points. When wetness rises before displacement accelerates, the relation deserves attention. When soil dries while movement remains active, another cause may be involved. The value is in comparing conditions, not in displaying an isolated moisture number.
A practical report links the condition value with time, place, and action. It should help a reviewer decide whether to keep observing, inspect the field point, compare nearby instruments, or record the event as normal site behavior.
For owners, the strongest record is the one that remains understandable after staff changes. Clear units, plain point names, installation photos, maintenance notes, and linked structural channels make the data usable beyond the original project team.
FAQ
Q: Where should a rain point be placed?
A: It should be level, open to the sky, and away from obstructions, splash sources, roof edges, and debris-prone areas.
Q: Where should wind be measured?
A: Wind should be measured where airflow represents the asset or work area being reviewed, not behind a wall or sheltered obstruction.
Q: How should soil points be installed?
A: They should have firm contact with the surrounding soil, a recorded depth, protected cable route, and a stable first value.
Q: What should commissioning records include?
A: Include point location, measured condition, unit, mounting photo, cable route, power source, data channel, and linked structural record.
Q: Why are photos useful?
A: Photos help future reviewers understand exposure, mounting, cable routing, and whether later site changes affected readings.
Maintenance teams should record cleaning, access difficulty, enclosure condition, cable repair, vegetation growth, nearby equipment changes, and the first normal reading after work. Those notes protect the meaning of the curve when old data is reviewed months later.
Reviews
Matthew Garcia
Instrumentation cables are durable and perform well even in harsh environments. Will definitely order again.
Christopher Martinez
Very satisfied with the readouts & data loggers. User-friendly interface and supports multiple sensor inputs.
Latest Inquiries
To protect the privacy of our buyers, only public service email domains like Gmail, Yahoo, and MSN will be displayed. Additionally, only a limited portion of the inquiry content will be shown.
Evelyn***@gmail.comSouth Africa
Hi, we are a contractor working on tunnel construction and need settlement sensors and displacement ...
Emma***@gmail.comCanada
Dear Sir/Madam, we are interested in displacement transducers and settlement sensors for a geotechni...
Related product categories
- wind direction and speed sensor
- wind speed and direction sensors
- tipping bucket rain gauge
- tipping bucket rain gauge resolution 0.2 mm standard
- tipping bucket rain gauges
- tipping bucket rain gauge resolution 0.1 mm 0.2 mm standard
- tipping bucket rain gauge resolution 0.1 mm standard
- rain gauge tipping bucket
- tipping bucket rain gauge sensor
- tipping bucket type rain gauge
- tipping rain bucket gauge
- tipping bucket rain gauge 0.2 mm per tip standard